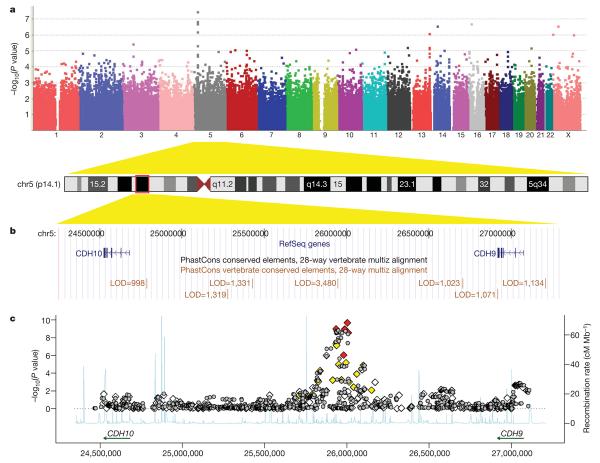
Figure 1. Genome-wide association results for the 5p14.1 region.
a, A Manhattan plot showing the −log10(P values) of SNPs from the combined association analysis of the AGRE and ACC cohorts. b, The 5p14.1 genomic region is displayed in UCSC Genome Browser, with conserved genomic elements in the PhastCons track. c, Both genotyped (diamonds) and imputed (grey circles) SNPs are plotted with their combined P values in all four cohorts. Genotyped SNPs were coloured on the basis of their correlation with rs4307059 (red: r2 ≥ 0.5; yellow: 0.2 ≤ r2 < 0.5; white: r2 < 0.2). Estimated recombination rates from HapMap data are plotted to reflect the local linkage disequilibrium structure.

