Figure 5.
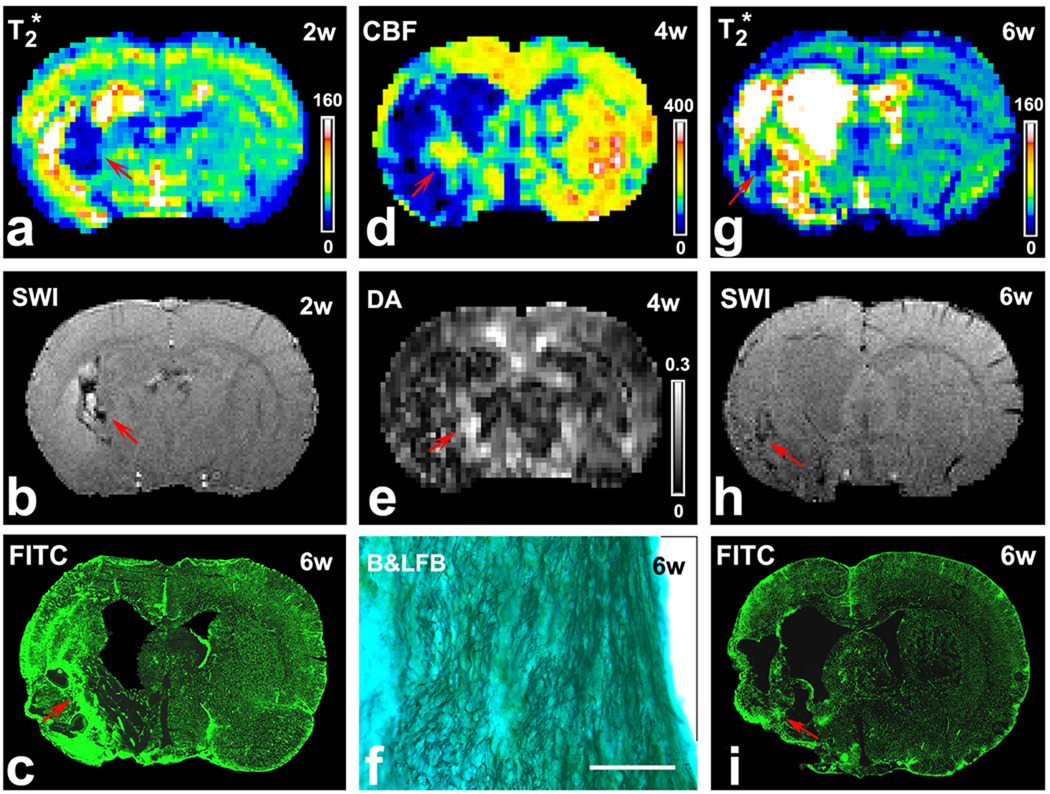
Images of T2* map (a) or SWI (b) at 2 weeks after stroke demonstrated angiogenesis (red arrows) in a representative EPO treated rat. FITC-dextran stained sections (c) showed increased microvessels in this region (red arrow). Elevated CBF was found in the same area (red arrow) at 4 weeks after stroke (d). Increased DA values (e, red arrow) were located in the same area as in the T2* map (a), SWI (b) and CBF (d). B&LFB stained sections demonstrated increased numbers of axons and highly ordered neuronal fibers in this region (f, bar = 100µm). In a representative control rat, T2* map (g) or SWI (h) at 6 weeks after stroke demonstrated smaller area where angiogenesis might happen (red arrows), which was confirmed by FITC-dextran stained sections (i, red arrow).

