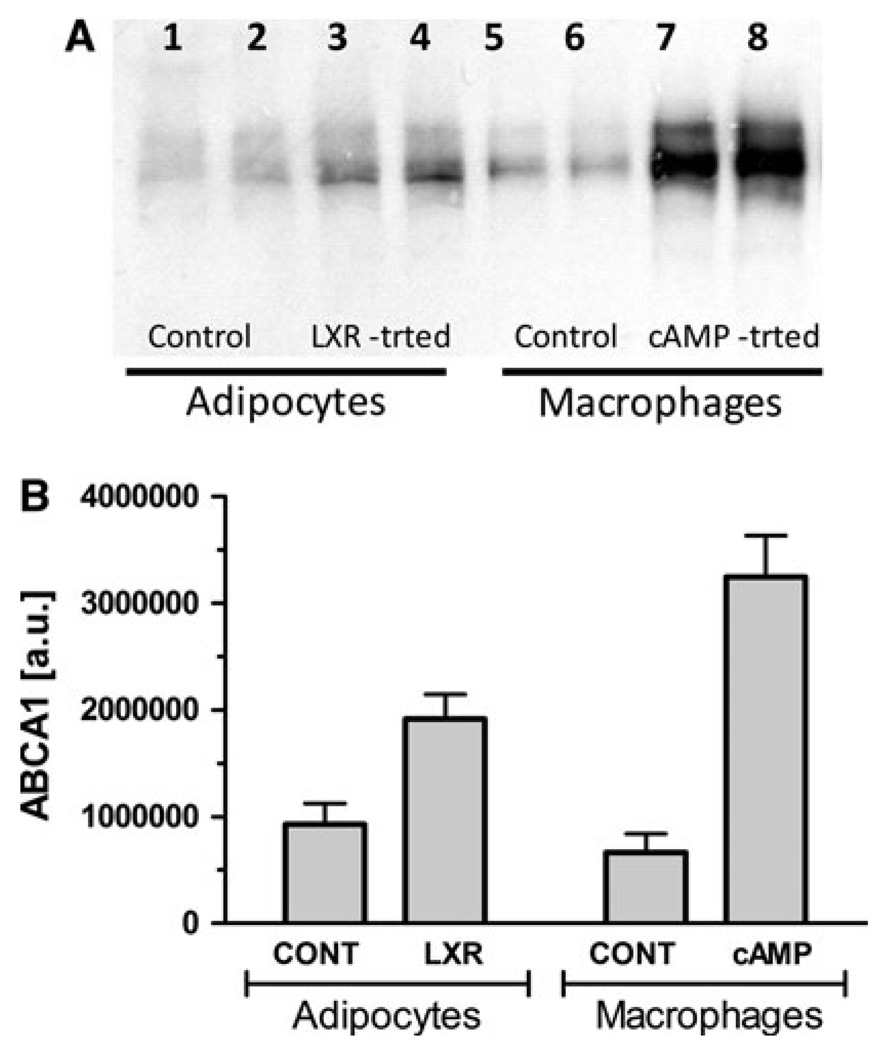
Fig. 2.
ABCA1 protein expression levels in adipocytes and macrophages. a Western blot: Aliquots of the cell homogenates from control and treated adipocytes and macrophages were loaded in the same gels and simultaneously blotted to allow semi-quantitatively estimation of the relative levels of ABCA1 for different treatments and cells. Each lane was loaded with 70 µg of homogenate protein. The Western blot shows the results of one experiment. Three separate experiments provided similar results. b Relative levels of ABCA1 protein: The level of ABCA1 protein was estimated by densitometric scanning of the western blots as explained in methods. The figure shows the relative average levels of ABCA1 normalized by cellular protein (mean ± SD). A total of seven samples from three separate experiments were included in the calculations of the means and corresponding SD. The differences between the means of control and LXR-treated samples of adipocytes, and also between control and cAMP-treated macrophages were estimated to be significant (P < 0.001)

