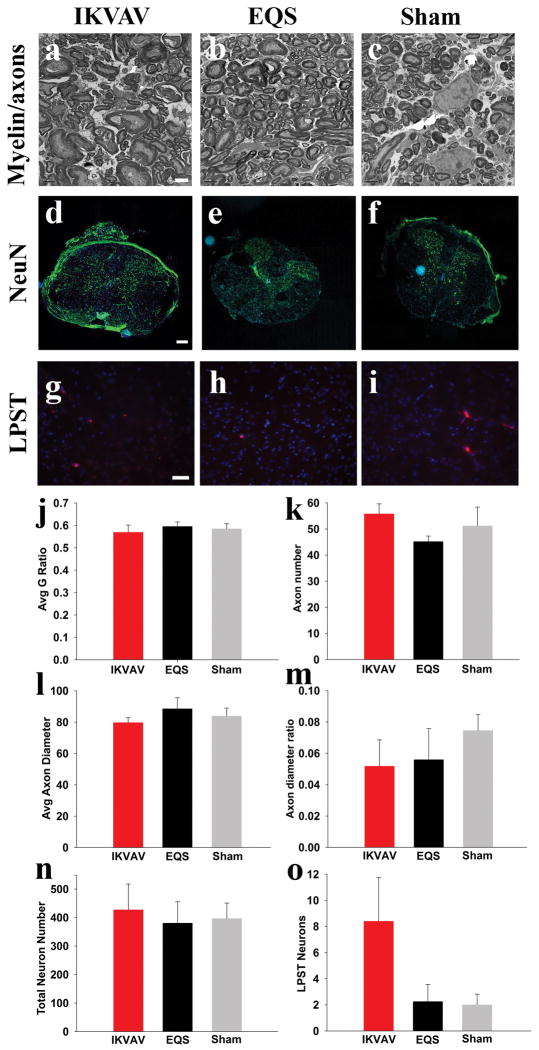
Figure 5. Changes in myelin thickness, axon diameter, axon number, neuron number, and long propriospinal tracts did not contribute to behavioral improvements.
A–C, Representative electron microscope images of IKVAV PA, EQS PA, and sham groups from which the myelin and axon data were derived. Scale bar: 2 μm. D–F, Representative fluorescent microscope images of neurons in spinal cord cross sections. (blue: Hoechst, green: NeuN) Scale bar: 200 μm. G–I, Representative fluorescent microscope images of long propriospinal tract (LPST) labeled neurons. (blue: Hoechst, red: rhodamine dye for LPST neurons). Scale bar: 20 μm. J–O, Bar graphs showing no significance between all groups for myelin G ratio (J), total axon number (K), mean axon diameter (L), ratio of small:large diameter axons (M), total neurons near lesion (N), or long propriospinal tract connections (O).

