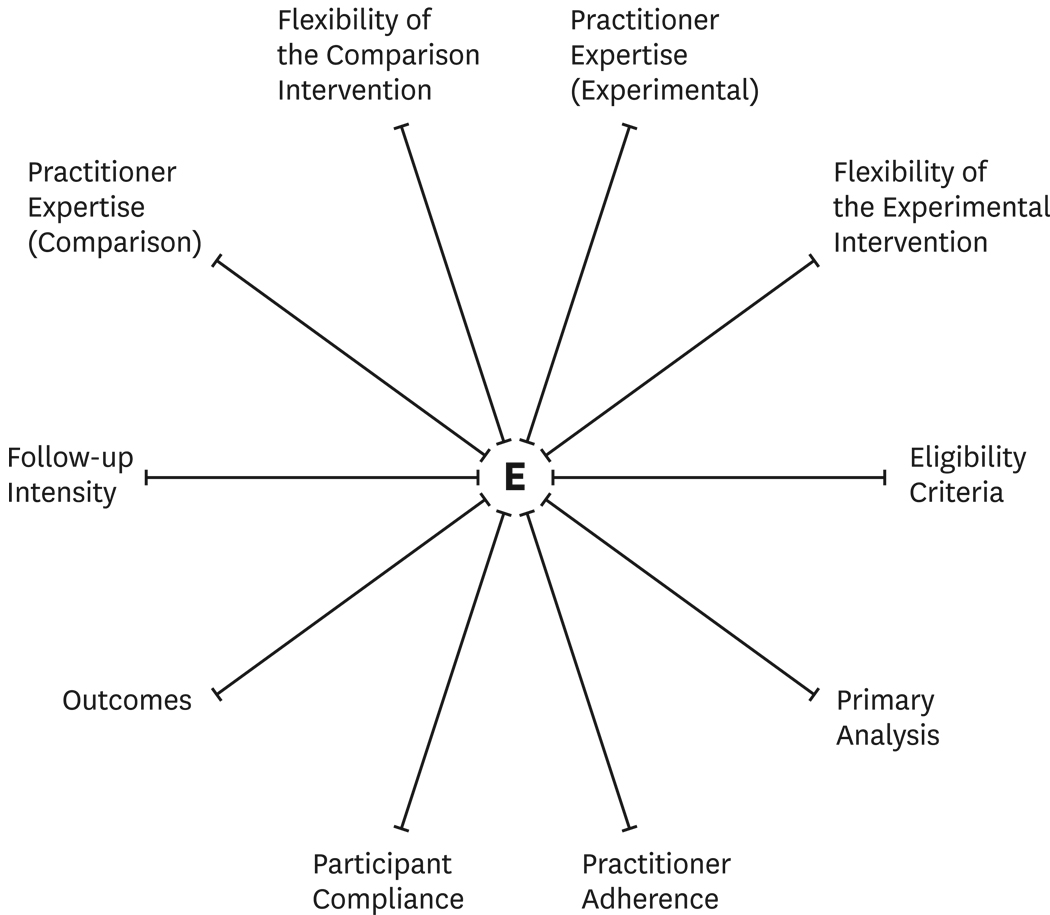
Figure 1.
The blank PRECIS wheel or spider graph indicating the pragmatic-explanatory continuum. Marks closer to the hub of the wheel indicate more explanatory characteristics while marks closer to the rim of the wheel indicate more pragmatic characteristics. (Reprinted with permission from the Journal of Clinical Epidemiology)

