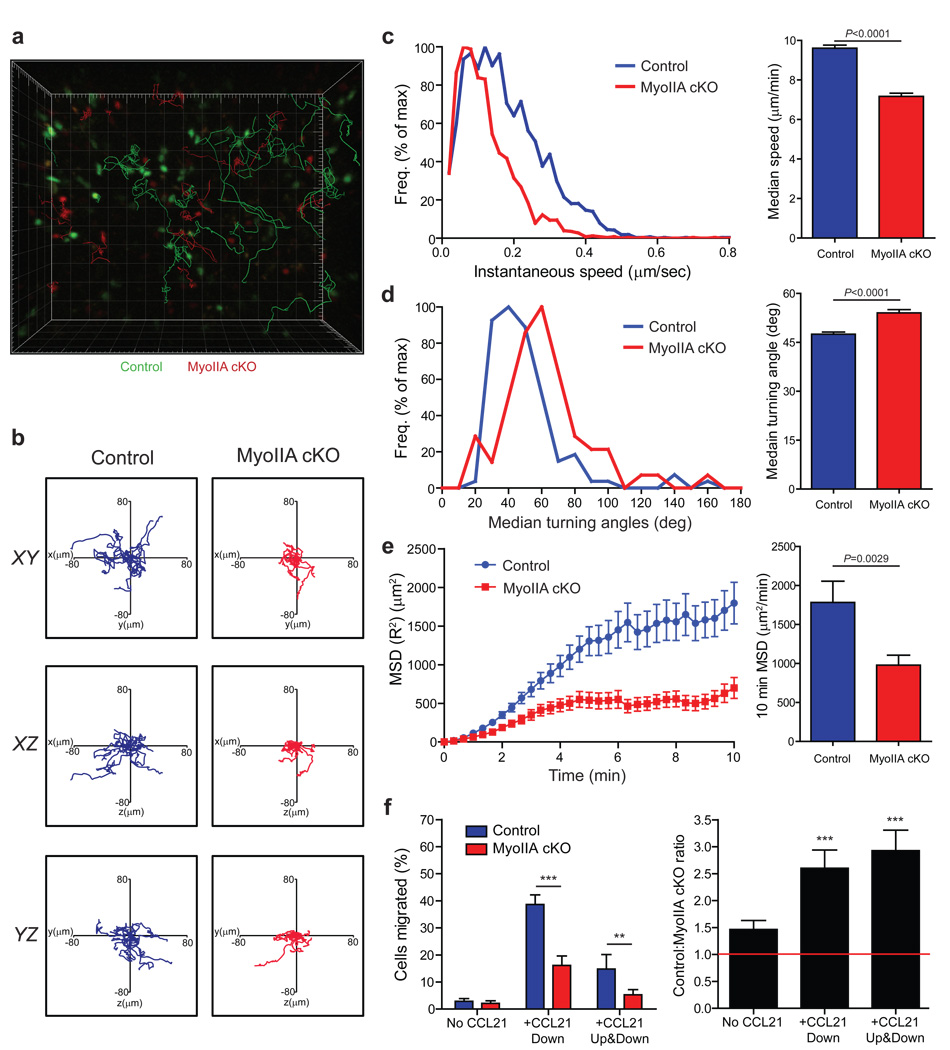
Figure 3. Naïve MyoIIA-deficient T cells have reduced intra-lymph node migration.
Control and MyoIIA cKO naïve CD8+ T cells were labeled and injected intravenously into recipient mice. Lymph nodes from recipient mice were then imaged by time-lapse 2-photon microscopy. a) Representative 3D reconstruction of a stage position with tracks overlaid. Control T cells in green and MyoIIA cKO in red; 20 randomly selected tracks are shown. b) Representative 10 min long tracks of 15 randomly chosen control and MyoIIA cKO T cells are shown. c) Representative distribution of instantaneous velocities (left panel) and average median velocity (±SEM) (right panel) of control and MyoIIA cKO T cells. d) Representative distribution of mean turning angles (left panel) and average median turning angle (±SEM) (right panel) of control and MyoIIA cKO T cells. e) Representative mean square displacements (MSD) (±SEM) over time (left panel) and average MSD over 10 min (right panel) of control and MyoIIA cKO T cells. f) Left panel, % migration (±SEM) of control and MyoIIA cKO naïve T cells in response to 1µg/ml CCL21 added to the bottom well (chemotaxis) or to both the top and bottom chambers of the transwell (chemokinesis). Right panel, ratio (±SEM) of control vs. MyoIIA cKO transmigrated T cells shown in the left panel. ** indicates P<0.01, and *** indicates P<0.001. Data in a, b, and left panels of c–e are from one stage position representative of three independent experiments. Data in f are averaged from three independent experiments; and right panels of c–e are pooled from multiple lymph nodes from each of three independent experiments.

