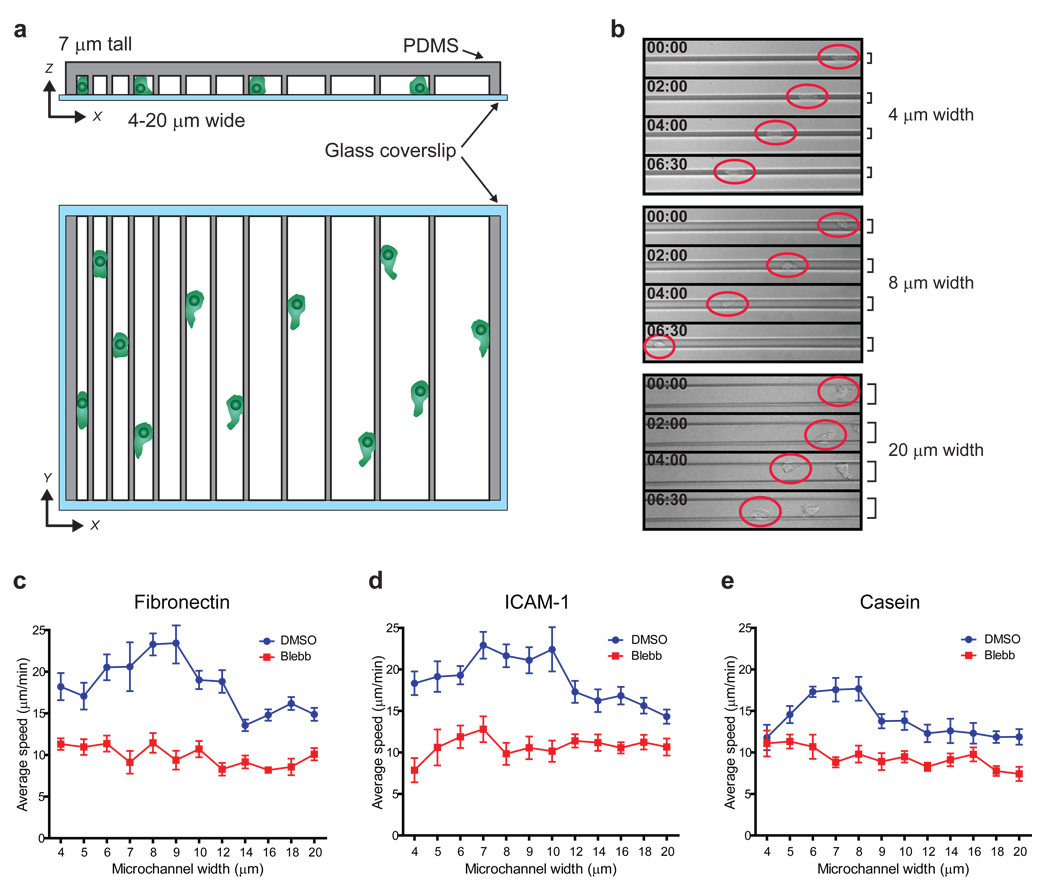
Figure 5. T cell migration efficiency within confined environments is controlled by MyoIIA.
CD8+ T cells 4–5 days post-activation were injected into micro-fabricated confining channels of variable size in the presence of vehicle control or 100 µM blebbistatin and then imaged. a) Schematic of variable microchannel array assembly. b) Representative examples of T cells crawling within microchannels of different width (as indicated) imaged by brightfield timelapse microscopy. Red circles highlight the position of the T cells; time is indicated in min:sec. c) Average speed (±SEM) shown as a function of microchannel size of control and blebbistatin treated T cells injected into fibronectin coated microchannels. d) Average speed (±SEM) shown as a function of microchannel size of control and blebbistatin treated T cells injected into ICAM-1 coated microchannels. e) Average speed (±SEM) shown as a function of microchannel size of control and blebbistatin treated T cells injected into casein coated microchannels. Data shown in b and c are representative of three independent experiments; data shown in d and e are representative of two independent experiments.

