Figure 3.
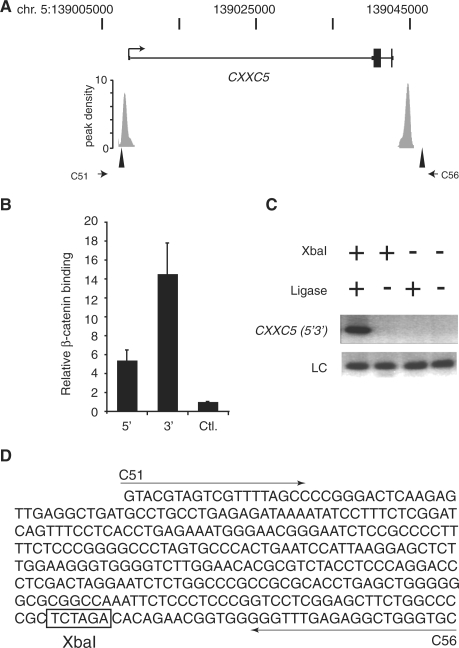
A chromatin loop containing 5′ and 3′ β-catenin enriched regions is detected at the CXXC5 gene. (A) Schematic of the CXXC5 locus with untranslated regions as thin rectangles, introns as thin lines, exons as thick rectangles and an arrow demarcating the transcription start site. The peak density plots below the gene represent β-catenin enriched regions identified in the ChIP-Seq library. The triangles and stunted arrows identify the XbaI sites and PCR primers, respectively, used in the chromatin conformation capture (3C) assay depicted in (C). (B) Real time PCR analysis of β-catenin ChIP assays performed in HCT116 cells. Specific oligonucleotides were used to detect β-catenin binding to enriched regions depicted by gray rectangles in (A). 5′ is the upstream site and 3′ is the downstream site. A distal upstream region of the MYC gene was used as a negative control (Ctrl). Error bars are SEM. (C) Agarose gel of PCR products generated from a 3C analysis of CXXC5 in HCT116 cells. Generation of the 3C product (CXXC5 5′3′) with primers C51 and C56 required the addition of XbaI and ligase to the reactions. LC is a loading control and S is a DNA standard. (D) DNA sequence of the 3C product. Arrows denote primer sequences C51 and C56 and the XbaI site are boxed.

