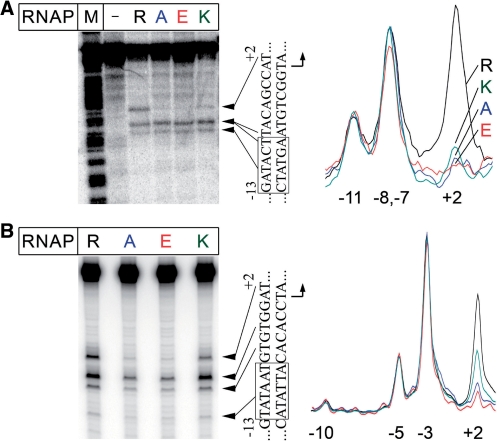
Figure 4.
Promoter melting by RNAPs with substitutions of β′ R339. (A) KMnO4 footprinting of the non-template strand in the T7A1 promoter complexes of the wild-type and mutant E. coli RNAPs. The experiment was performed at 37°C as described in ‘Materials and Methods’ section. The ‘M’-lane is an A+G cleavage marker. The sequence of the melted promoter region is shown on the right of the gel. The −10 element is boxed. Scanned profiles of modification of thymine residues in the melted region are shown on the right of the figure. The numbers indicate promoter positions relative to the starting point of transcription. (B) KMnO4 footprinting of the non-template strand of the λPR promoter complexes.

