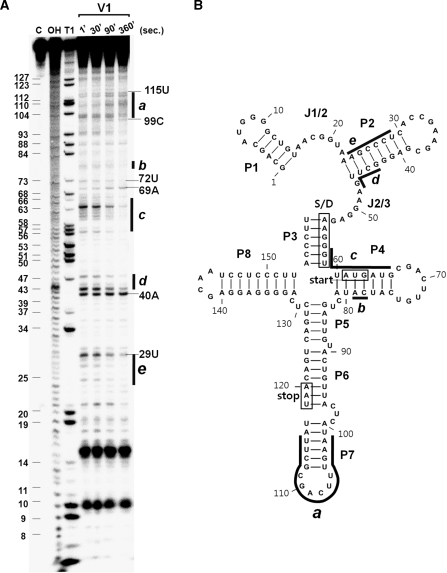
Figure 8.
Time course of the interactions between SibC and ibsC RNA. (A) 32P-labeled ibsC RNA (10 nM) was incubated with 50 nM of unlabeled SibC RNA at 37°C for 1, 30, 90 and 360 s. Samples were withdrawn from each time point and digested with RNase V1 for 15 min. The reaction was stopped by ethanol precipitation. Lanes C and OH correspond to untreated ibsC RNA and alkaline hydrolysis ladders, respectively. Lane T1 corresponds to G ladders generated by RNase T1 under denaturing conditions. The regions showing significant changes in the intensities of bands are denoted as a to e. (B) The regions showing significant changes during the time course of incubation are also shown in the secondary structure model of ibsC mRNA.

