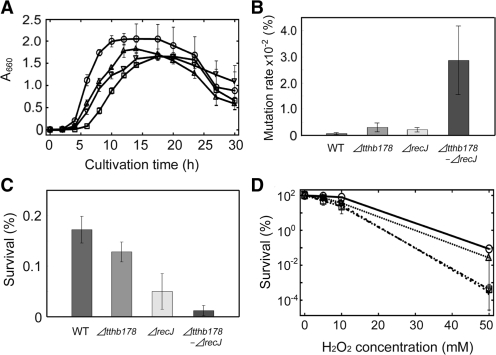
Figure 2.
Effects of the disruptions of the tthb178 and recJ genes on the growth of T. thermophilus HB8. (A) Growth curves of the WT (circles), ΔrecJ (triangles), Δtthb178 (inverted triangles) and the double disruptant (squares). Growth was monitored by measuring the absorbance at 660 nm. (B) Spontaneous mutation rates of each strain to the streptomycin-resistant strain. (C) Sensitivity to 254-nm UV-C irradiation. The survival ratios are shown as a bar graph. (D) Sensitivity to H2O2. The survival ratios were plotted against the H2O2 concentration. The symbols are the same as in (A). In all panels, the data represent the averages of at least three independent experiments and each bar indicates the SD.

