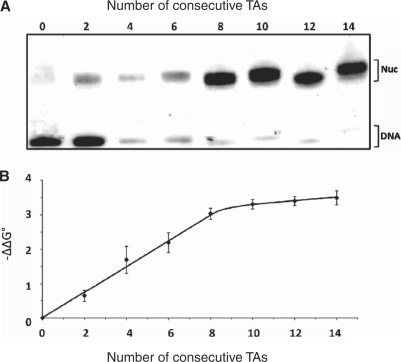
Figure 2.
Variation of the free energy of nucleosome formation with the number of consecutive period-10 TAs. (A) PAGE autoradiogram of different labeled 200-bp DNA fragments, having from 0 to14 period-10 TAs located in the center, reconstituted competitively using a low core histone to bulk DNA ratio. (B) The x-axis is the number of consecutive TAs in the center of each DNA fragment, and the y-axis is the calculated value of –ΔΔG°, obtained from analysis of the data shown in (A), as described in the text and Supplementary Data. Error bars represent the SD from three independent experiments.

