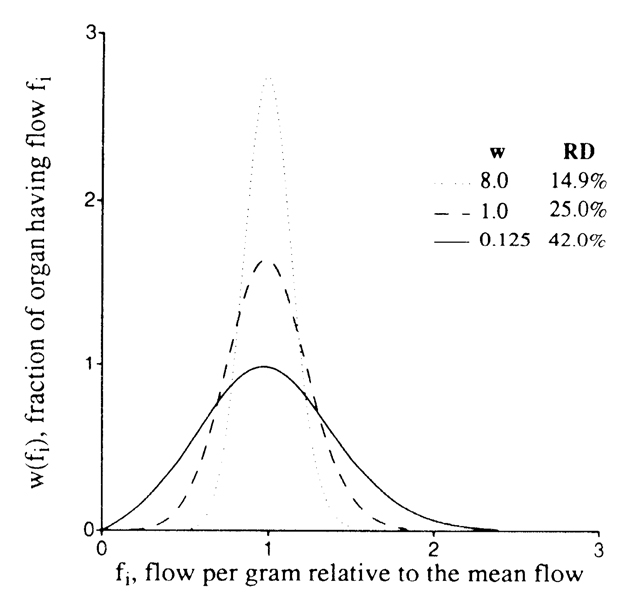
FIGURE 3.
Diagram of distribution of blood flows in a 64-g sheep heart. Flows (abscissa) are relative to mean flow for the heart, and ordinate is fraction of the mass of the heart with a given local flow per gram of myocardium. Area of each curve is unity, as for any probability distribution, Fractal description is RD(w) = 25 w −0.25 with w, sample size in grams; RD, relative dispersion, equal to standard deviation divided by the mean; and fractal D = 1.25.

