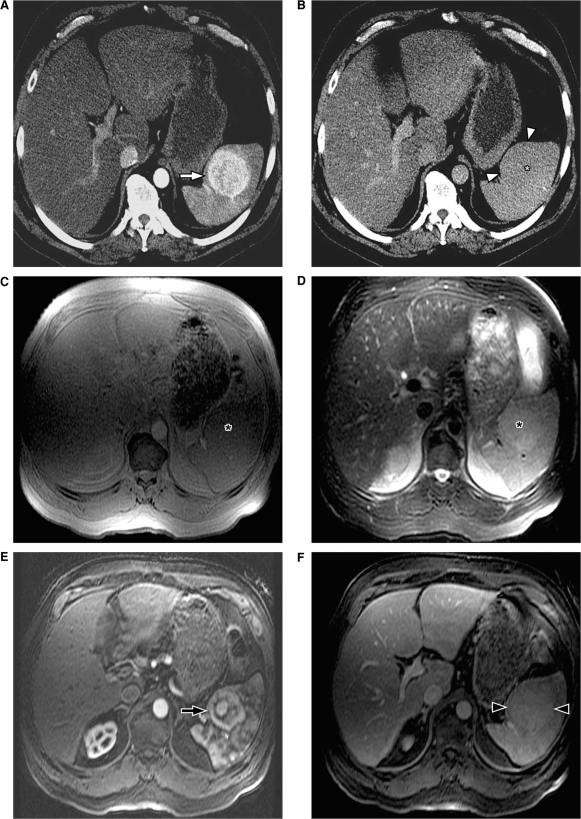
Figure 6.
Splenic hamartoma. (A) Arterial phase of contrast-enhanced CT shows an enhancing mass in the spleen (arrow). (B) The mass is isodense on the venous phase (asterisk) and can be appreciated only as a capsular bulge (arrowheads). On MRI, the mass is isointense on the T1-weighted inphase (C) and is slightly hyperintense on the T2-weighted fat-saturated sequence (asterisk) (D). After gadolinium administration, heterogeneous enhancement is noted in the arterial phase (arrow) (E) with uniform delayed enhancement noted on the delayed phase (arrowheads) (F).

