Figure 2.

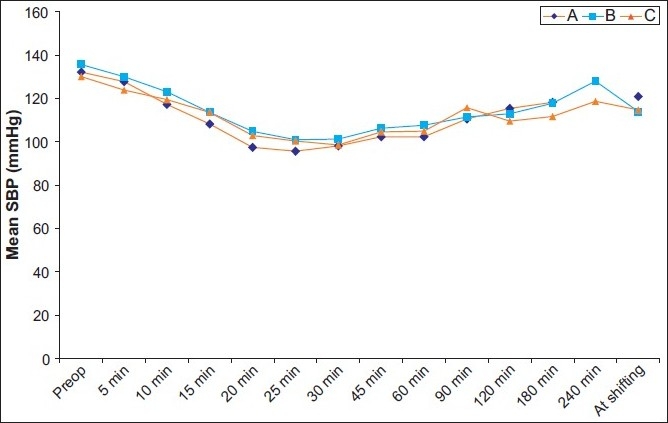
Systolic arterial blood pressures (SAP) in the operative period. There were no significant differences between groups. Data are given as mean (SD)

Systolic arterial blood pressures (SAP) in the operative period. There were no significant differences between groups. Data are given as mean (SD)