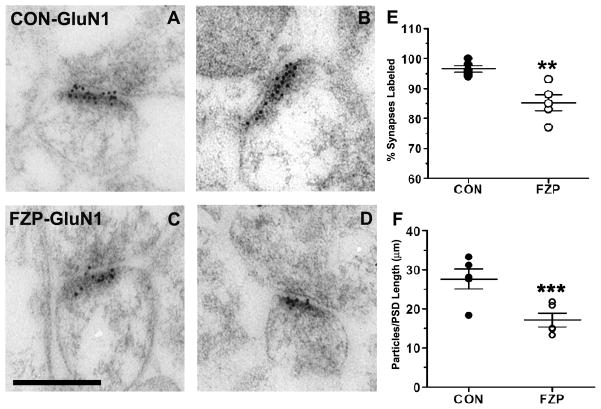
Figure 1. GluN1 subunit immunogold labeling is decreased in hippocampal CA1 asymmetric synapses during FZP withdrawal.
(A, B) Representative electron micrographs of GluN1-subunit immunogold labeling in hippocampal CA1 stratum radiatum from control tissues. Immunogold particles (10 nm) are located primarily within the postsynaptic density (PSD) and some particles extend into the synaptic cleft. (C, D) Representative images of GluN1-labeled asymmetric synapses from FZP-withdrawn tissues show similar distribution of immunogold labeling. (E) The percentage of synapses with immunogold labeling for GluN1 (containing at least one immunogold particle) was significantly reduced (**p<0.01) in synapses from FZP-withdrawn rats (white dots) compared to controls (black dots). Each dot represents the average obtained from a single animal (n = 50 to 71 synapses per animal, see Table 1). The average for all animals (large horizontal bar) and standard error of the mean (SEM, smaller bars) are superimposed to the dot plots (n=5 animals). (F) GluN1 immunogold density estimated by the number of gold particles per micron synaptic length was also notably reduced in synapses from FZP-withdrawn rats (white dots) compared to controls (black dots)(n=5 rats/group, ***p=0.009). As above, average ± SEM for all five animals is superimposed in the aligned dot plot. Scale bar in C represents 0.25 μm. All images are at the same magnification.

