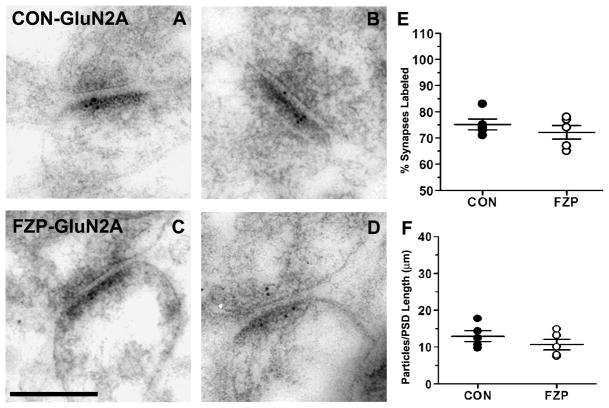
Figure 3. GluN2A subunit immunogold labeling was unaltered in hippocampal CA1 asymmetric synapses during FZP withdrawal.
(A, B) Representative electron micrographs of GluN2A-immunogold labeled synapses from control and (C, D) FZP-withdrawn tissues. In contrast to changes observed in GluN1 and GluN2B, GluN2A immunogold labeling during FZP-withdrawal did not show significant (p>0.017) changes compared to controls in either percentage of synapses labeled with at least one immunogold particle (E) or mean GluN2A immunogold density (F) (n = 5 rats/group). As in Figures 1 and 2 each dot represents a single animal average (47 to 72 synapses analyzed in each animal, see Table 3) with the total five animals average and SEM superimposed. Error bars indicate SEM. Scale bar in C represents 0.25 μm. All images are at the same magnification.

