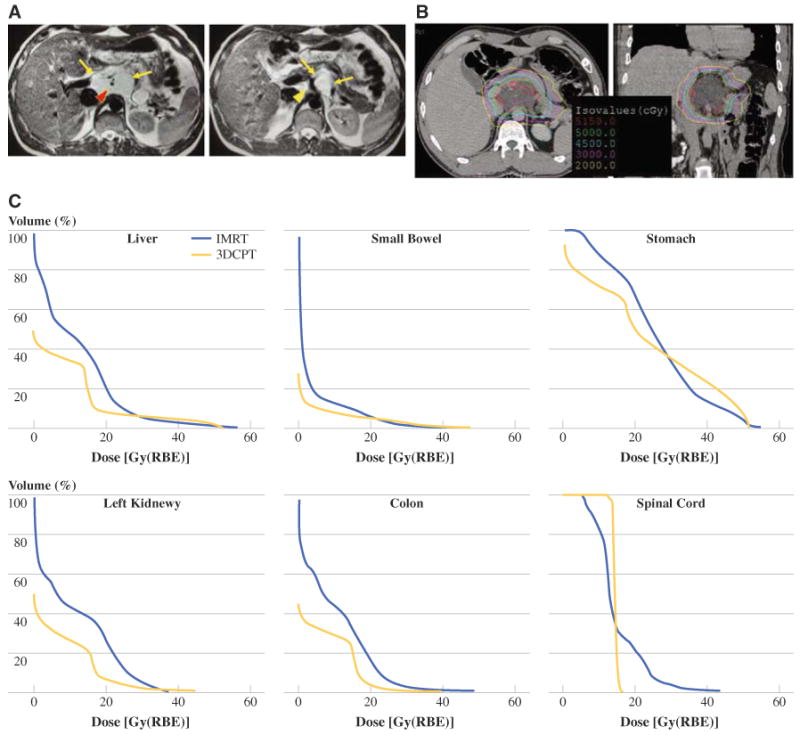
FIG. 3.

a Axial images of abdominal magnetic resonance imaging demonstrating myxoid liposarcoma (outlined in yellow arrows) encasing left gastric vessels (red arrowhead) and celiac axis (yellow arrowhead). b Proton-beam radiotherapy planning computed tomographic scan demonstrating isodose lines. c Dose volume graphs comparing IMRT versus 3D conformal protons (3DCPT) for liver, small bowel, stomach, kidney, colon, and spinal cord
