
Figure 2.
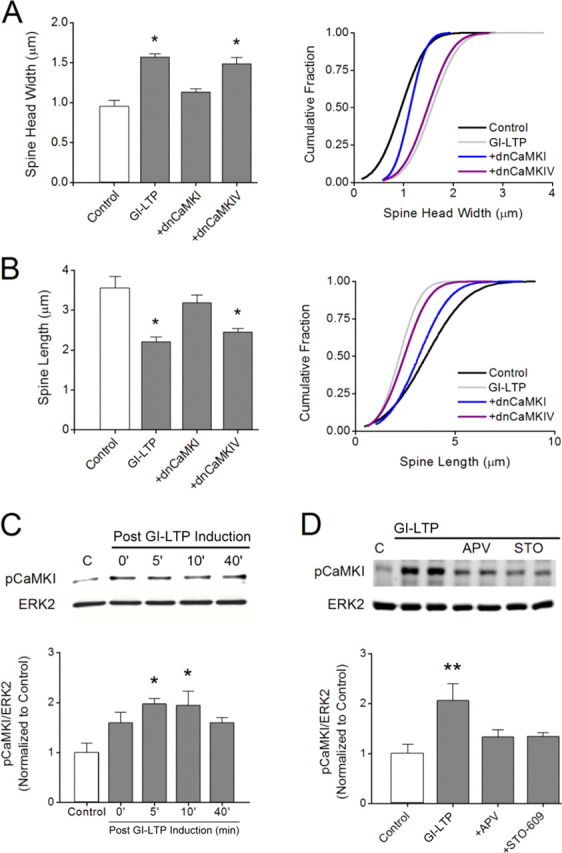
CaMKK signals through CaMKI but not CaMKIV to induce GI-LTP structural plasticity. A, B, Quantitative analysis (left) and cumulative distribution plots (right) for spine head width (A) and spine length (B) for each condition shown. Neurons were transfected with plasmids expressing dnCaMKI or dnCaMKIV 48 h before GI-LTP induction. *p < 0.05 by Student's t test. C, Top, Representative Western blots for pCaMKI and total ERK2 (loading control) for the indicated time points after the 10 min GI-LTP treatment. Bottom, Quantification of pCaMKI intensities before and after GI-LTP (n = 3 independent experiments). Error bars indicate SEM (n = 3 from 3 independent experiments). *p < 0.05 by one-way ANOVA. D, Top, Representative Western blots of pCaMKI and total ERK2 5 min after GI-LTP induction with or without APV or STO-609 (STO) treatments as in Figure 1. Bottom, Quantification of pCaMKI intensities for each condition shown (n = 3–5 from 3 independent experiments). Group data shown as mean ± SEM. **p < 0.01 by Student's t test.