Figure 5.
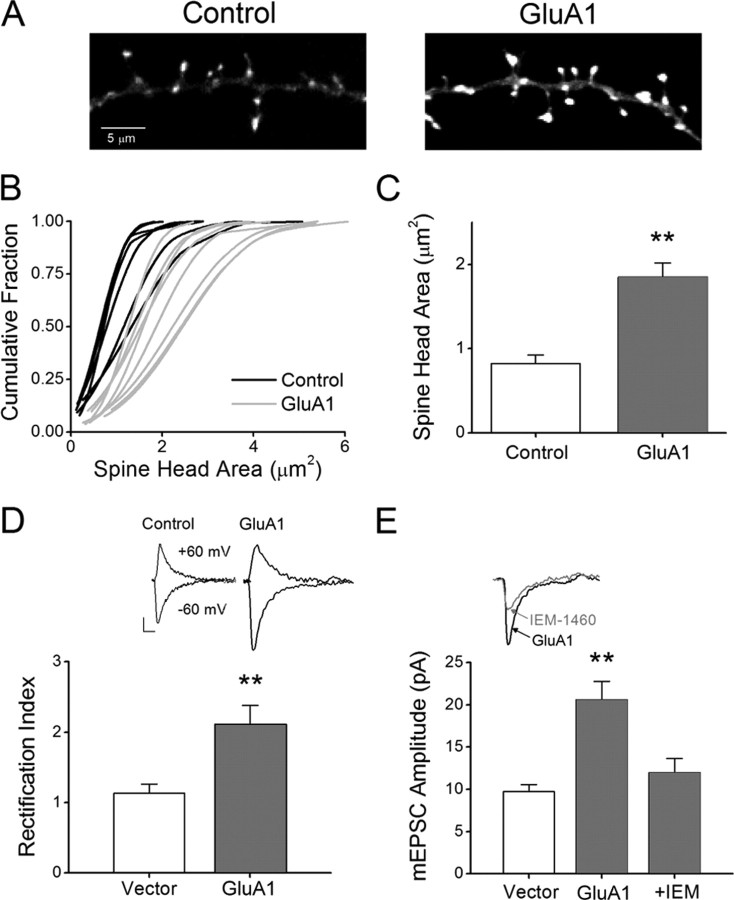
Overexpression of GluA1 increases spine head area, mEPSC amplitude, and synaptic expression of CP-AMPARs. A, Fluorescence images of dendritic spines expressing mRFP-β-actin plus vector (left) or GluA1 (right). B, Cumulative distribution plots for control neurons (black) and neurons expressing GluA1 (gray). C, Mean data for neurons plotted in B. Error bars indicate SEM (n = 8 per condition from 2 independent experiments; **p < 0.01 by Student's t test). D, Top, Example of mEPSCs recorded from a vector only (control) or GluA1-expressing neuron at two different holding potentials (−60 and 60 mV). Bottom, Mean rectification index, an indicator of CP-AMPARs, for vector only and GluA1 expressing neurons. Rectification index was calculated by dividing the absolute mean peak amplitude recorded at 60 mV by the peak amplitude recorded at −60 mV for individual neurons. Error bars indicate SEM (n = 6 recordings per condition; **p < 0.01 by Student's t test). E, Top, Example traces of mEPSCs recorded at −60 mV from a GluA1-expressing neuron illustrating sensitivity toward IEM-1460 (30 μm), an antagonist of CP-AMPARs. Bottom, Pooled data for mean mEPSC amplitudes for vector (n = 6), GluA1 (n = 6; **p < 0.01 by Student's t test) and GluA1 in the presence of IEM-1460 (IEM; n = 4; **p < 0.01 by paired Student's t test).

