Figure 6.
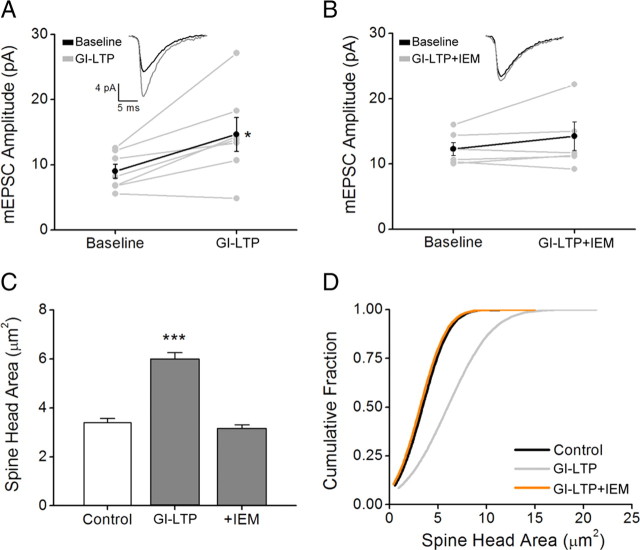
GI-LTP increases mEPSCs and recruitment of synaptic CP-AMPARs. A, Individual mEPSC amplitudes plotted before (Baseline) and 40 min after GI-LTP. Mean amplitudes are denoted by black filled circles. Error bars indicated SEM (n = 7 from 3 independent cultures). *p < 0.05 by paired Student's t test. Inset, Example mEPSC traces before and after GI-LTP. Traces are an average of 50 consecutive events. B, Plot of mEPSCs as described in A before (Baseline) and after GI-LTP in the presence of IEM-1460 (IEM). Error bars indicate SEM (n = 6 from 3 independent cultures). C, Pooled data of spine head area (n = 50–75 spines per neuron; 5–8 neurons per coverslip) for controls and neurons after GI-LTP in absence or presence of IEM-1460. Error bars indicate SEM (n = 6–8 coverslips/ condition). ***p < 0.001 by Student's t test. D, Cumulative distribution of spine head areas for each condition indicated.

