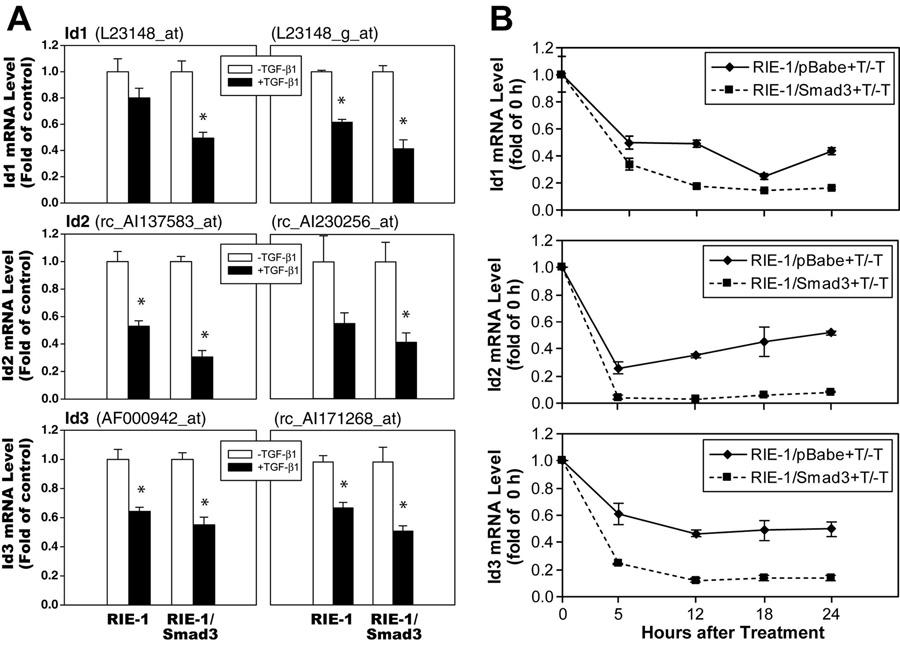
Figure 2. TGF-β repressed Id mRNA expression.
A. Cells were treated with TGF-β1 (120 pmol/L) for 6 h. Total RNA was extracted and Affymetrix Oligonucleotide Microarrays were applied to examine Id1 gene expression with two probes: L23148_at and L23148_g_at; Id2 gene expression with two probes: rc_AI137583_at and rc_AI230256_at; and Id3 gene expression with two probes: AF000942_at and rc_AI171268_at. Three independent experiments were performed. Id mRNA levels were represented as fold of control in TGF-β1 treated groups and expressed as means ± SEM. B. Cells were treated with TGF-β1 (40 pmol/L) and harvested at different time points. Total RNA was extracted and real-time PCR was applied to examine Id expression to confirm Microarray results. Id mRNA levels were represented as fold of vehicle control in TGF-β-treated groups.

