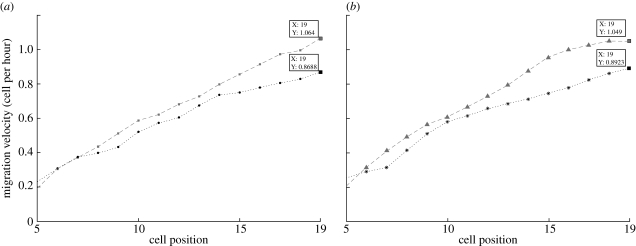
Figure 5.
Mean migration velocity of cells at different positions in the crypt. The results found in (a) scenario 1 (squares with dashed line, results from the two-dimensional lattice model (with differential adhesion); filled circles with dotted line: results from the two-dimensional lattice model (without differential adhesion)) and (b) scenario 2 (triangles with dashed line: results from the two-dimensional lattice model (with differential adhesion); asterisks with dotted line, results from the two-dimensional lattice model (without differential adhesion)) show that, with differential cell adhesion, cell velocity is increased. The average is taken over cells from 20 datasets.

