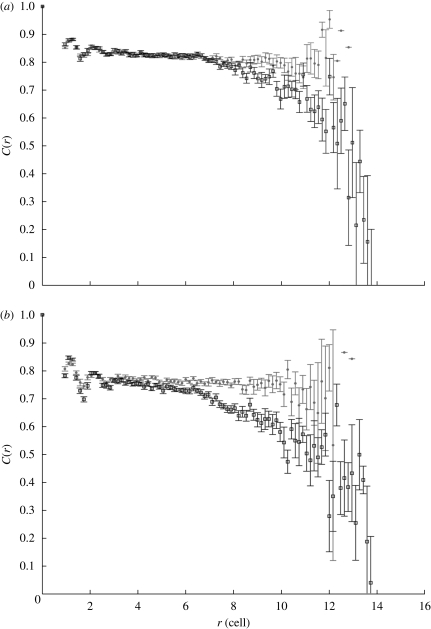
Figure 6.
Spatial correlation of the cell velocity in cells with differential adhesion (circles) and cells without differential adhesion (squares). Comparison of cells with differential adhesion and without differential adhesion shows that the velocities of cells with differential adhesion are highly correlated; however, without differential adhesion, the spatial correlation of the velocity decreases when cell distance increases—(a) scenario 1; (b) scenario 2. Data are determined from cells in 20 datasets. The distance between cells, r, is normalized to the target cell diameter. Standard error (s.e.) bars are shown in the figure.

