Figure 6.
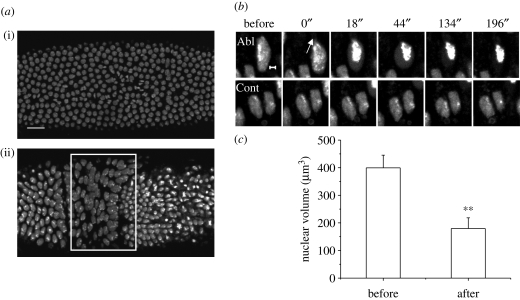
(a) Two distinct time points during Drosophila gastrulation—just after the 13th mitotic cycle (i) and after the onset of gastrulation (ii). The embryo is viewed from the dorsal side with the anterior to the left. The white rectangle indicates the nuclei of the germ band and amnioserosa cells. Scale bar, 20 µm. (b) Elongated cells of the germ band and early amnioserosa were ablated at the point indicated by the white arrow in the cytoplasm. Circularization and chromatin condensation were evident in the ablated cell, but not in control cells in the same neighbourhood. Scale bar, 2 µm. (c) The fall in nuclear volume is shown in the graph, before and after such ablations (n = 5). All error bars are standard deviations. Student's t-test, **p < 0.001.

