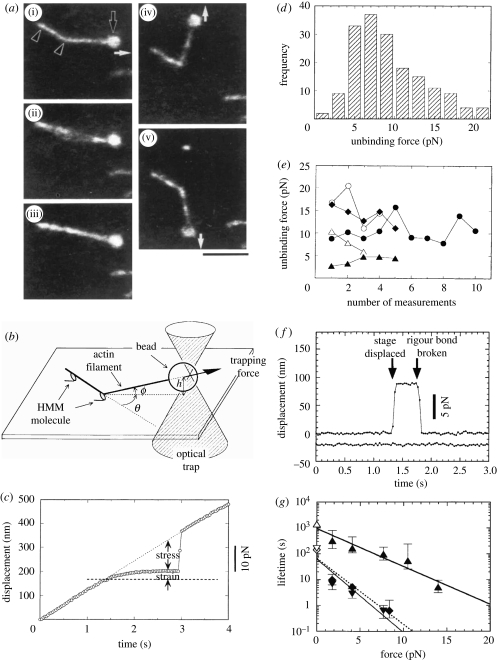
Figure 1.
Single-molecule response of actomyosin bonds to load. (a) A series of fluorescence micrographs showing the measurement of the unbinding force of a rigour bond(s) between an actin filament and a single HMM molecule. The bead (indicated by the black arrow in (i)) was trapped by a single laser beam and moved at a constant rate in the direction indicated by the white arrow, such that the actin filament became taut. The actin filament was attached to the surface by two separate HMM molecules identified as two nodal points (black arrowheads in (i)). As the laser spot was further moved, the load on the nearest HMM molecule increased and subsequently one of the two molecules unbound (ii), such that the filament became nearly straight (iii). The actin filament could be reattached to the same position while the second molecule was still attached, and the external loads could be imposed in any direction, as indicated by the white arrows (iv,v). Scale bar, 5 µm. (b) Schematic illustration of (a): θ is the angle of the applied force, h (less than 1 µm) is the distance between the bead and a glass surface (θ ≤ 10°). (c) Time course of the movement of the trap centre (dotted line, 120 nm s−1, corresponding to an approximately 12 pN s−1 loading rate) and the trapped bead (circles) to which an actin filament was attached. The unbinding force between an actin filament and an HMM molecule was estimated from the abrupt displacement at 2.9 s, when the rigour bound was ruptured. (d) Histogram of the unbinding forces between a single actin filament and a single HMM molecule. (e) Effect of the number of measurements. Different symbols represent different HMM molecules. (f) An example of the time course of the displacement of the bead. The upper and the lower plots show, respectively, the displacement of the bead along and perpendicular to the actin filament. The stage was displaced stepwise at 1.3 s to impose a constant external load, and the bond ruptured after 0.43 s in this example. (g) Relation between the imposed load and the lifetime of HMM and S1 rigour bonds. Triangles and inverted triangles show the slow and the fast components of HMM, respectively. Diamonds show the lifetime of S1. The thick and thin solid lines show the approximation of slow and fast components of HMM, respectively. The dashed line shows the approximation for S1. (Adapted from Nishizaka et al. 1995, 2000).

