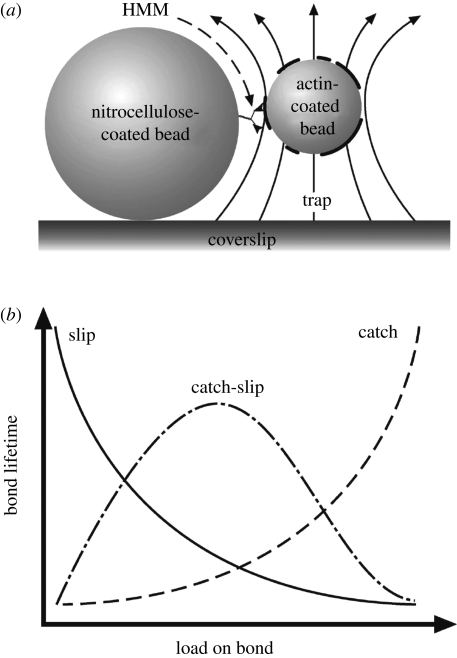
Figure 2.
Force spectroscopy of actomyosin bonds under perpendicularly applied load. (a) Schematic showing the arrangement for actomyosin force spectroscopy using the laser trap. (b) Illustration of the expected responses of catch, slip and catch–slip bonds to imposed loads when measured in terms of bond lifetime. (Adapted from Guo & Guilford 2006.)

