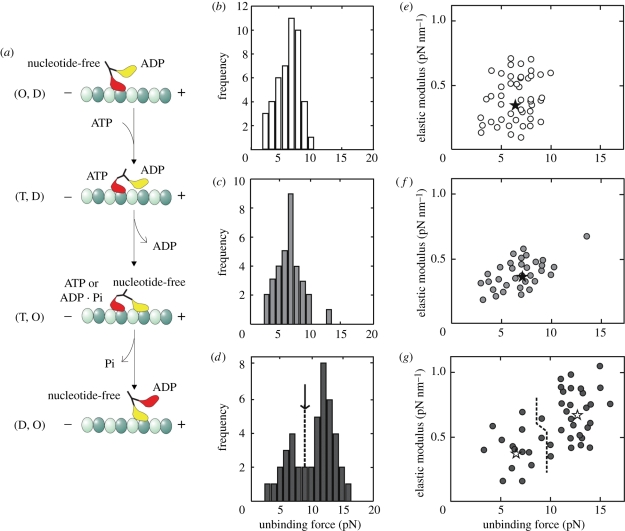
Figure 3.
Experiments probing the major prediction of the ‘hand-over-hand’ model of kinesin motility. (a) A simplified version of the ‘hand-over-hand’ model on the mechanism of kinesin motility. O, nucleotide free; D, T and Pi, ADP, ATP and inorganic phosphate, respectively. Distribution of unbinding force (b–d) and relation between elastic modulus and unbinding force (e–g) at different nucleotide-bound states. The external load was applied toward the plus end. (b,e) Nucleotide-free (n = 46); (c,f) AMP–PNP + ADP (n = 33); (d,g) + AMP–PNP (n = 43). Unbinding force (pN) ± s.d.: 6.7 ± 1.8 (b), 7.2 ± 2.0 (c), 6.6 ± 1.7 (n = 14), 12.8 ± 1.6 (n = 29) (d). Elastic modulus (pN nm−1) ± s.d.: 0.35 ± 0.14 (e), 0.37 ± 0.16 (f) and 0.39 ± 0.17 (n = 14), 0.67 ± 0.21 (n = 29) (g). Loading rate (pN s−1): 3.5 (b,e), 6.0 (c,f) and 4.3 (d,g). A single Gaussian distribution could simulate unbinding force distribution in (b,c). In contrast, the unbinding force distribution in (d) was simulated by the sum of two Gaussian distributions, with S- and L-components defined as the smaller and larger unbinding force, respectively. The boundary between the S- and L-components was determined by the junction of two Gaussian distributions (shown by an arrow (d)); the boundary in (g) was determined according to that in (d). The average values for S- and L-components are shown by asterisks in (e)–(g). (Adapted from Kawaguchi & Ishiwata 2001.)

