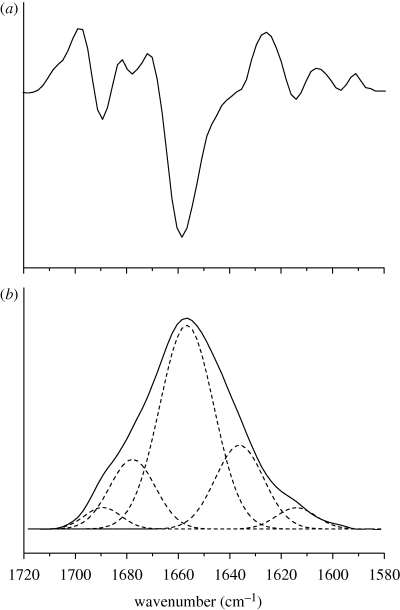
Figure 7.
FTIR spectrum (amide I band) of a 5 mg ml−1 insulin solution at pH 2.0. (a) Second derivative spectrum. (b) Amide I band with Gaussian peak fitting. Peak positions were determined by second derivatives (upper spectrum) and assigned to secondary structures: α-helix 1656 cm−1, intramolecular β-sheet 1636 cm−1, intermolecular β-sheet 1614 cm−1, other 1678 and 1689 cm−1. Percentile structural contents were then quantified by peak fitting (lower spectrum) assuming a Gaussian peak shape.

