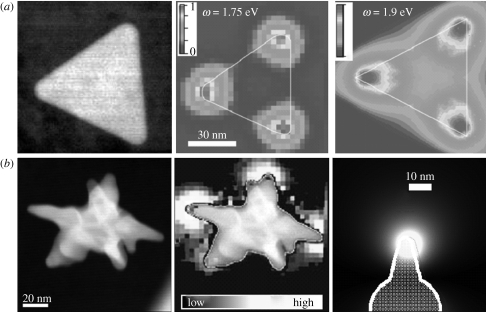
Figure 2.
High-resolution scanning transmission electron microscopy (STEM) dark-field image, electron energy loss spectroscopy (EELS) intensity mapping and calculated EELS intensity map of (a) a single Ag triangle and (b) an Au nanostar. Adapted from (a) Nelayah et al. (2007) and (b) Rodriguez-Lorenzo et al. (2009). Copyright © Nature Publishing Group (2007) and ACS Publishing (2009).

