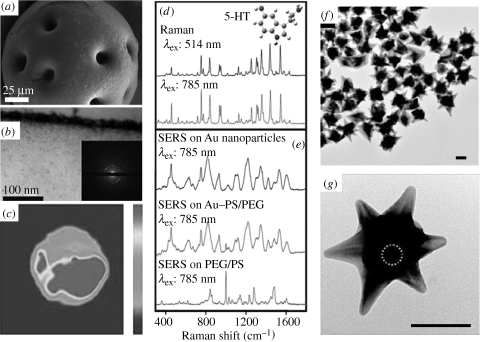
Figure 4.
(a) SEM image of Au–PEG/PS bead. (b) Cross-sectional TEM image and electron diffraction pattern of the bead crust. (c) SERS mapping of one Au–PEG/PS microbead, showing the distribution of serotonin (5-HT) (at 1531 cm−1). (d) Raman spectra of 5-HT obtained with different excitation wavelengths. (e) SERS spectra of 5-HT on Au colloids and on Au–PEG/PS microbeads (Raman scattering spectrum of PEG/PS with the same concentration of 5-HT is also shown). Adapted from Farah et al. (2009). (f,g) TEM images of Au nanostars with superparamagnetic cores (bar = 50 nm), with the approximate position of the Fe3O4 core outlined by a dashed circle. Adapted from Wei et al. (2009). Copyright © Wiley Interscience (2009) and ACS Publishing (2009).

