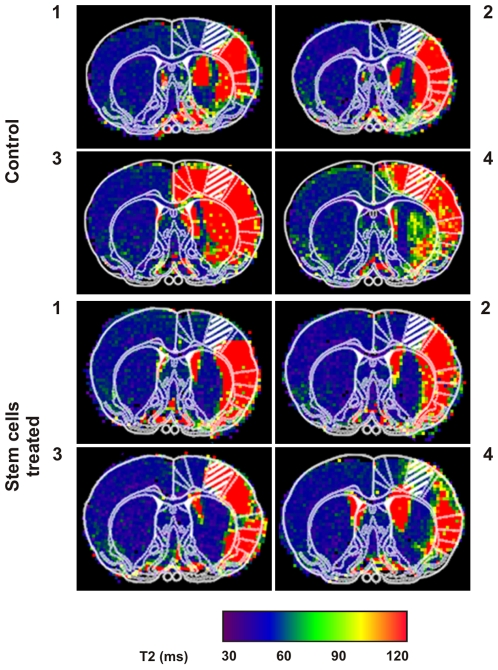
Figure 5. Spread of ischemic lesion.
T2 maps of the 4 control (top) and 4 stem cell implanted (bottom) animals used in our study. The corresponding coronal sections of the Paxinos and Watson atlas of the rat brain [12], with the key brain region S1FL shadowed, have been superimposed in each image, showing that animals labeled as 3 and 4 for each group presented lesions that include this region of the cortex, while in the others (animals 1 and 2 of each group) the S1FL region is not affected.

