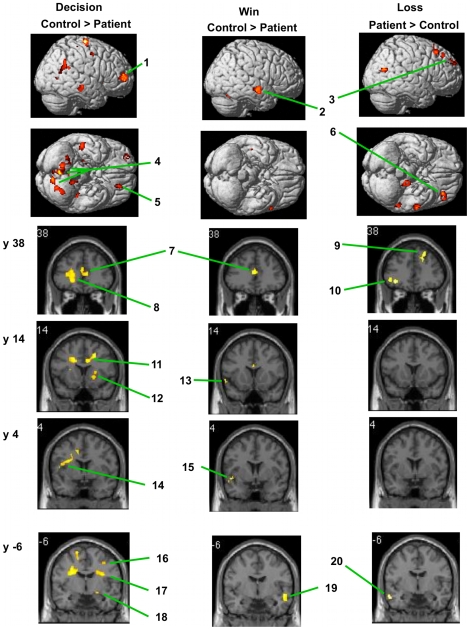
Figure 3. Selected regions more activated in one group (patients or controls) than in the other.
Regions significantly more activated in controls than in patients: Left column, during decision-making (cf. Table 5 for contrast and details); middle column, while experiencing wins (cf. Table 8 for contrast and details). Regions significantly more activated in patients than in controls: right column, while experiencing losses (cf. Table 11 for contrast and details). Row 2: left is at bottom. Rows 3–6: left is at left. Values of “y”: for slices in that row, distance (mm) rostral (+) or caudal (−) from anterior commissure. Numbered regions: 1, middle frontal gyrus BA 10; 2, middle temporal gyrus BA 21; 3, medial frontal gyrus BA 9; 4, uvula (vermis) and pyramis; 5, medial frontal gyrus BA 10; 6, middle frontal gyrus BA 11, 47; 7, anterior cingulate BA 24, 32; 8, middle frontal gyrus BA 11; 9, superior frontal gyrus BA 8; 10, middle frontal gyrus BA 11, 47; 11, anterior cingulate BA 24; 12, putamen; 13, superior temporal gyrus, BA 38; 14, insula BA 13; 15, superior temporal gyrus BA 22; 16, middle frontal gyrus BA 6; 17, insula BA 13; 18, amygdala; 19, middle and inferior temporal gyri BA 21; 20, inferior temporal gyrus BA 21.

