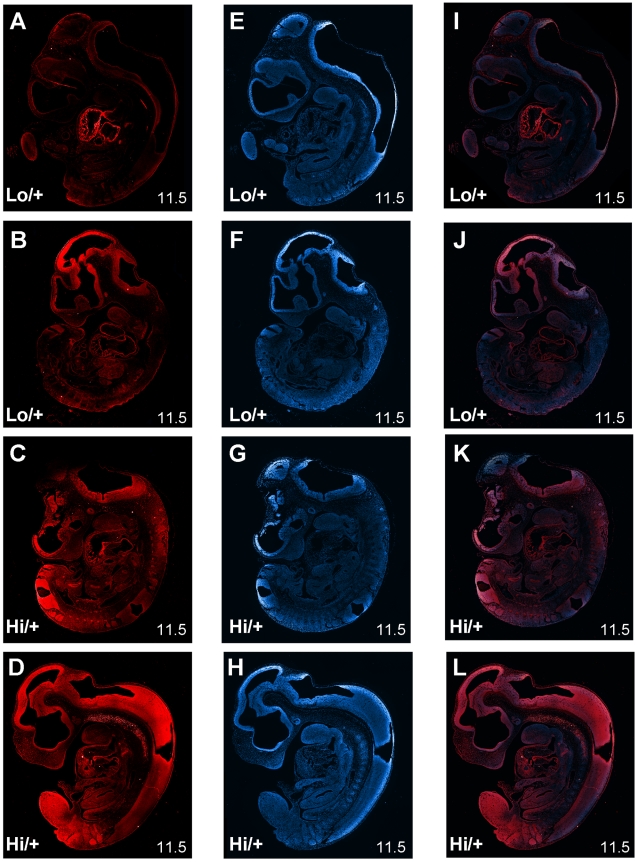
Figure 5. Immunofluorescence of E11.5 Ctgf Lo and Hi embryos.
Panels A) – D) are stained with an anti-CTGF antibody and a Alexa 594 (Texas Red) secondary. Panels E) – H) are stained with DAPI to highlight nuclei. Panels I) – L) are a merge of the Red and the DAPI layer. Genotypes for each panel are as marked on the panel. The panels in each row are from the same section. All panels are at 5× magnification.

