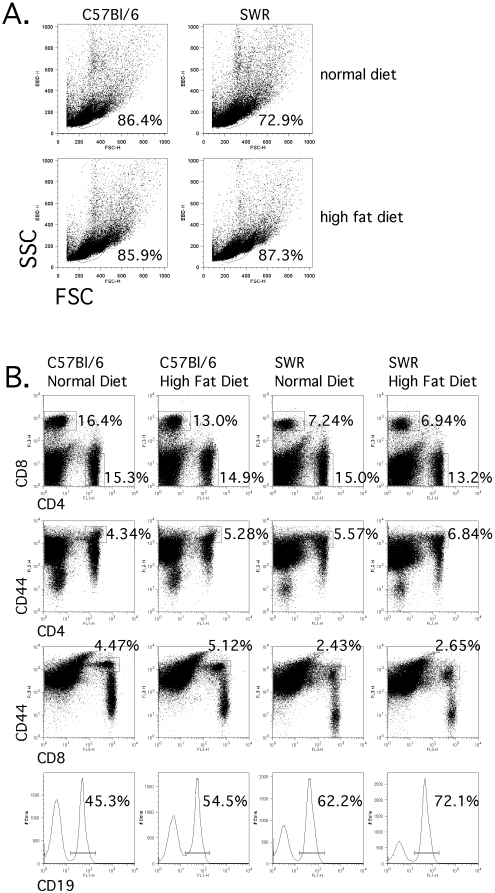
Figure 8. T cell population frequency percentages were not different between strains.
Splenocytes from identically housed C57BL/6 and SWR/J mice fed control or high-fat diet were isolated and cell frequencies were measured by flow cytometry. A) Total lymphocyte frequencies by strain and diet. B) Frequencies of CD4+, CD8+, CD4+/CD44hi, CD8+/CD44hi, and CD19 cells were determined.

