Figure 1.
Figure 1a. T2 weighted images and the corresponding <D>, FA, Ktrans and ve maps from a 67 years old patient with PSA = 7.1 ng/mL, who had biopsy proven adenocarcinoma in the right midgland (top) and negative biopsies in another patient (69 years old, PSA = 4.6 ng/mL ) (bottom). The tumor in the right midgland of the peripheral zone is clearly visible as a hypointense area on the T2 weighted image and <D> map, and as a hyperintense area on the Ktrans map (top row). Note that neither FA nor ve show differences between the tumor and the normal peripheral zone, which is consistent with the average values of these parameters across the patient population in this study (see Table 2). Although Ktrans values in some areas of the central gland appear as high as in the tumor, the average Ktrans value across the patient population in the tumor was significantly higher than in the central gland.
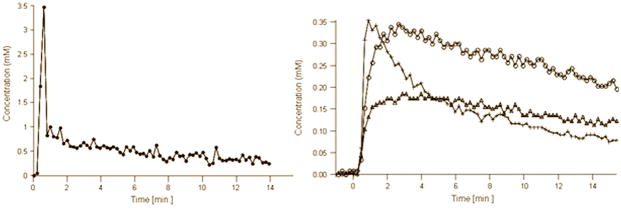
Figure 1b. AIF (left) and representative concentration vs. time curves (right) from PCa (crosses), normal PZ (open triangles) and CG (open circles) extracted from the DCE data shown at the top of Figure 1a. Zero on the time axis corresponds to the bolus arrival time in the external femoral artery. Note that the concentration vs. time curves were adjusted for the bolus arrival time.


