Figure 2.


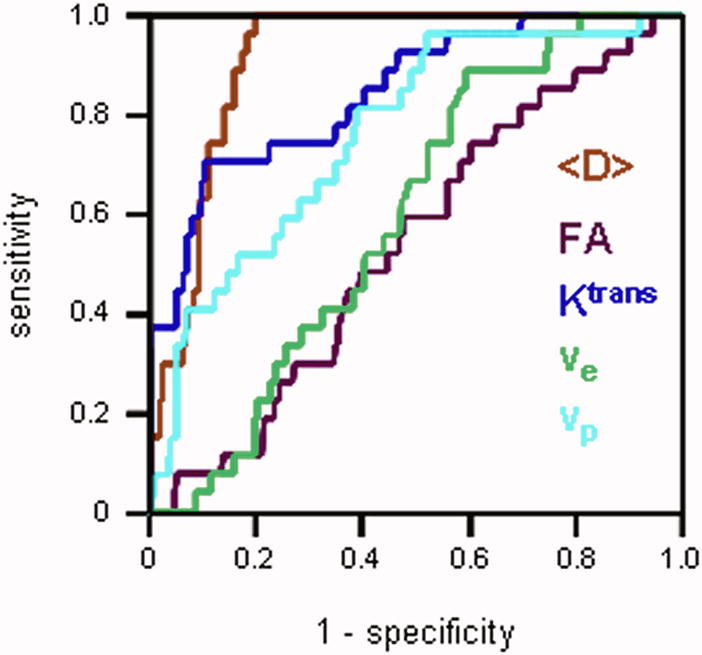
Figure 2a. ROC curves generated for each MRI parameter. The average diffusivity <D>had the largest area under the ROC curve. ROC curves for the FA and ve lay close to the diagonal, suggesting that these parameters alone are not particularly useful in distinguishing between cancer and normal PZ.
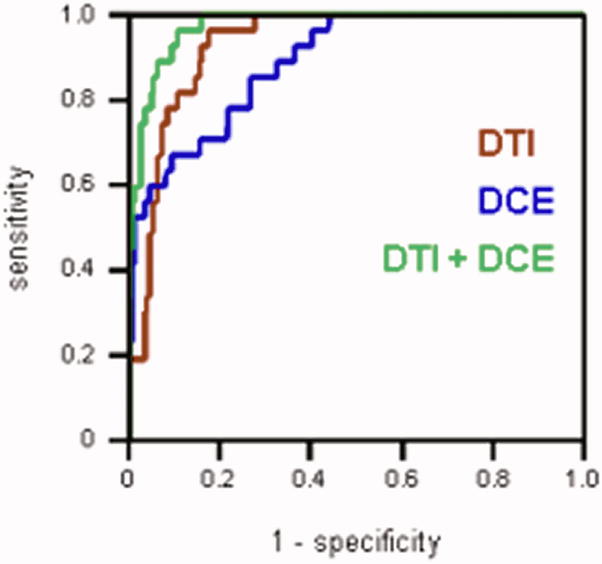
Figure 2b. ROC curves generated with the logistic regression model for: DTI parameters (red), DCE MRI parameters (blue), and DTI + DCE MRI parameters (green). The AUC calculated for DTI + DCE MRI parameters was significantly higher than that for either the DTI or the DCE MRI parameters alone.
