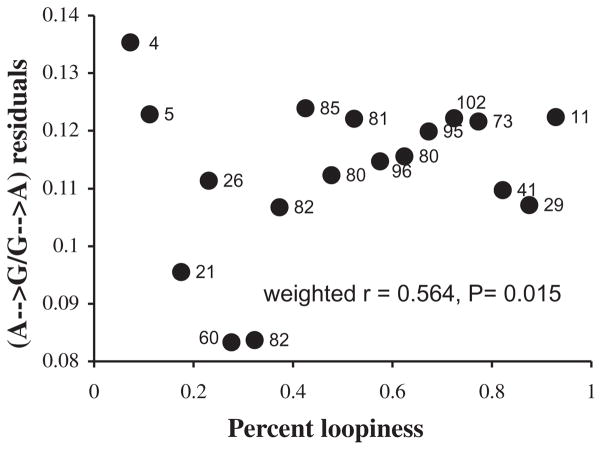
FIG. 5.
Excess purine transition asymmetry as a function of loopiness. Residual A → G/G → A ratios were calculated assuming DssH as an independent variable in a standard linear regression analysis. The loopiness at each site was calculated as the fraction of structures in which that site was part of a loop (rather than a stem); all predicted mRNA secondary structures that were at least half as stable as the optimal structure in each species were considered. Sites were grouped into 17 categories based on their loopiness values, and the correlation coefficient (r = 0.564, p = 0.015) was calculated with points weighted by the number of sites in each category. Points are labeled with the number of sites in each category.

