
Figure 1. Decline in excess mortality between 1999 and 2007.
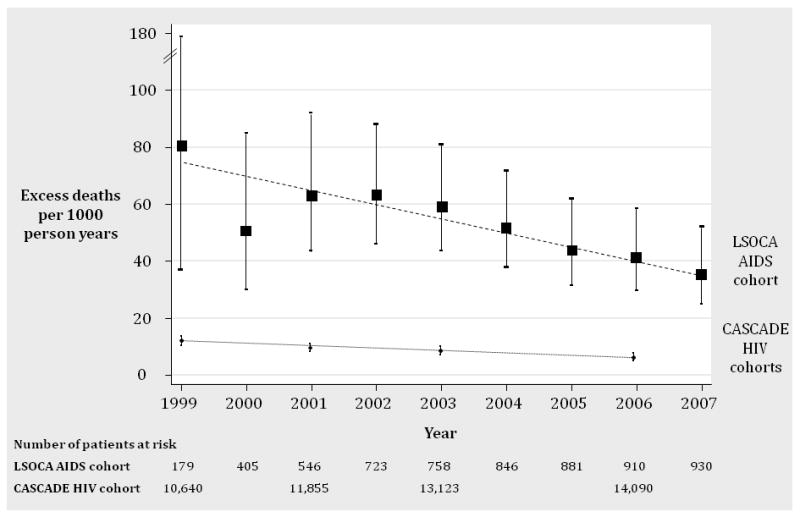
The figure shows the decline in excess mortality in the LSOCA AIDS cohort and in the CASCADE HIV cohorts between 1999 and 2007. The upper line in the graph shows the number of excess deaths per 1,000 person years (solid rectangles) in patients with AIDS enrolled in LSOCA and 95% confidence intervals. The dashed line represents the fitted line based on a Poisson regression model. The annual decline in excess mortality averaged 8.0% per year (95% CI 3.0 to 12.7, p=0.002). The lower line in the graph shows the number of excess deaths per 1,000 person years (solid circles) in HIV patients enrolled in the CASCADE cohorts and 95% confidence intervals. The dotted line represents the fitted line based on a Poisson regression model. The annual decline in excess mortality averaged 4.8% (95% CI 3.1 to 6.5, p<0.001).