
Table 3.
Comparisons of sequences from the four subfamilies of A-conotoxins
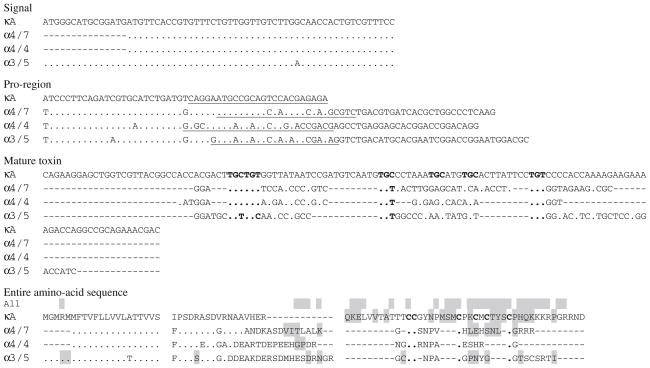 |
Sequences for κA, α4/7, α4/4, and α3/5 are, respectively, C4.2, Cn1.2, Sm1.3, and S1.10b. Cys pattern are in bold; positively selected sites are shaded (PP of BEB analysis > 0.95 with either M1/M2 or M7/M8 comparison); potential specific primers for each subfamily are underlined. “All”: result of the site model analysis performed with all the sequences