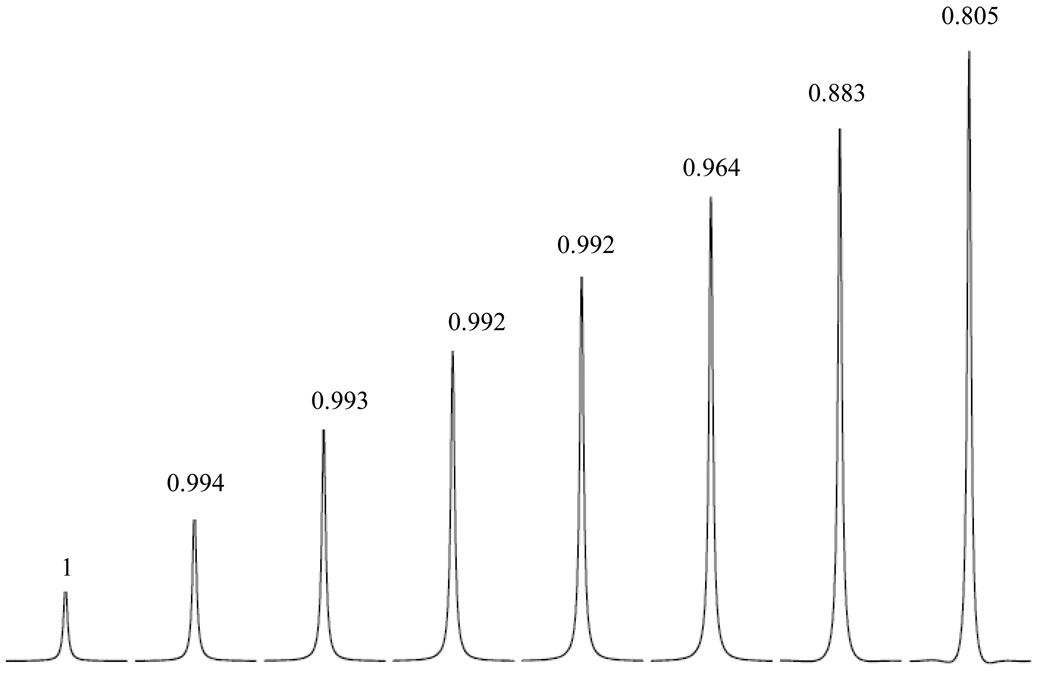
Figure 2.
Linear NMR receiver many not be maintained when the FID output surpasses 55% of the maximum receiver output for a Bruker spectrometer. The numbers above and under the resonance peak represents the NMR peak integration normalized by sinθ and the highest FID signal level as a percentage of maximum output allowed by the receiver. Though rolling baselines are clearly visible when FID output reaches 72% of the maximum, they are less apparent when the receiver is just slightly compressed (at the 65% level).

