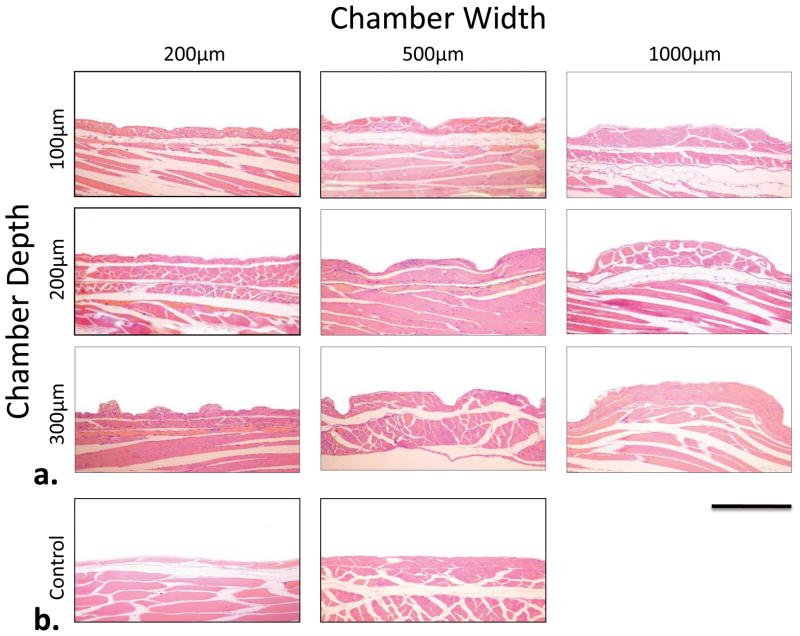
Figure 5.
Representative micrograph of sectioned and stained wound tissue following 12 hr application of μCAD device. Experimental groups results are shown in (a). Representative deformation from the negative control is shown on the left in (b) and the positive control results are shown on the right. Bar = 500 μm, 10x magnification.

