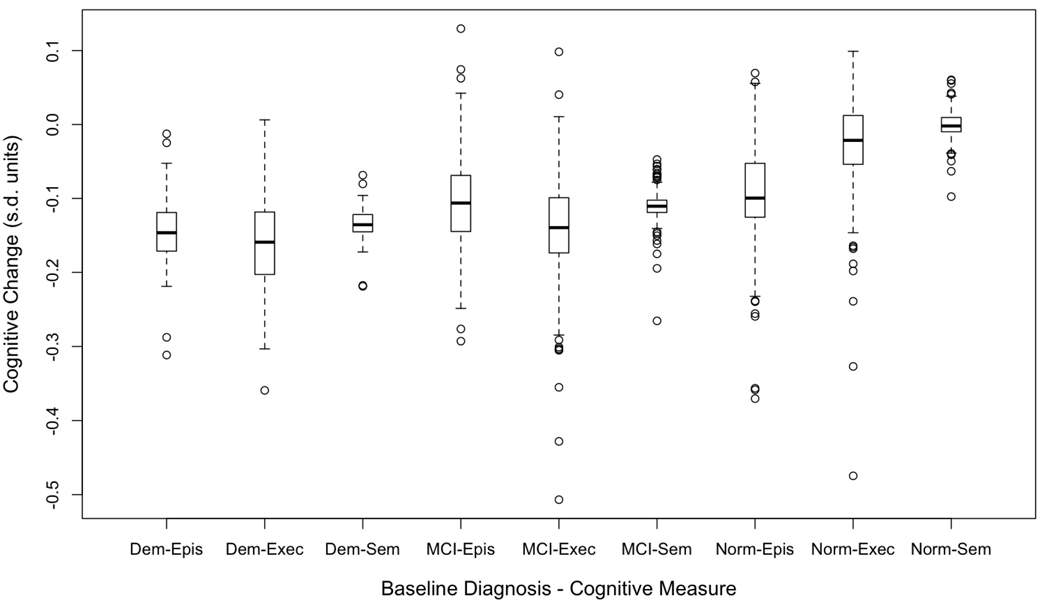
Figure 4.
Box plots showing distributions of annual rate of change in cognitive variables as measured by the sum of the predicted change for the diagnostic group and the person specific random deviation from this predicted value. The box demarcates the range from the 25th to the 75th percentile of the distribution, the line in the middle of the box is the 50th percentile, the lower horizontal line is at the 10th percentile, and the upper horizontal line is at the 90th percentile. Dem = Dementia, MCI = Mild Cognitive Impairment, Norm = Normal, Epis = Episodic Memory, Sem = Semantic Memory, Exec = Executive Function.

