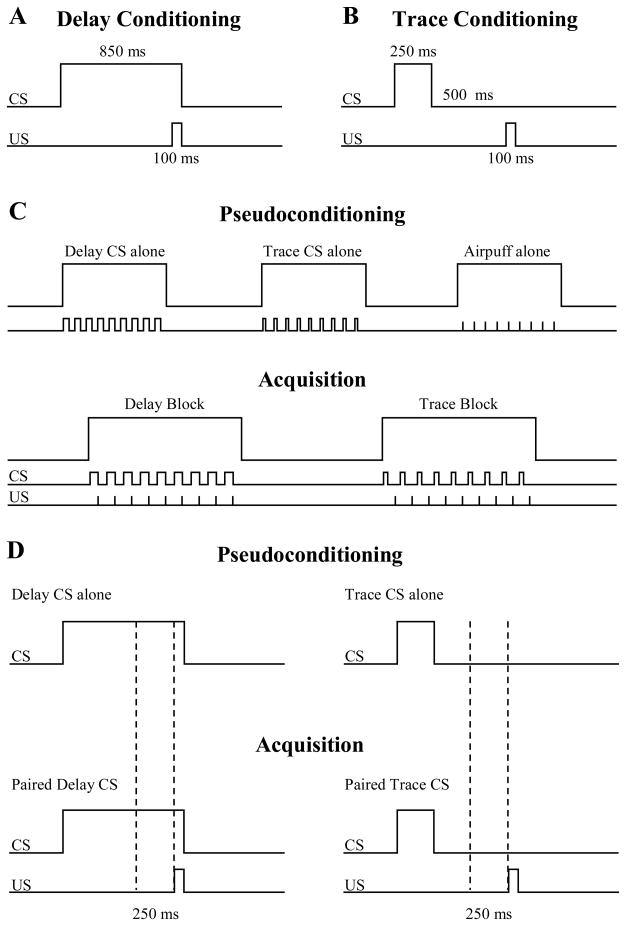
Figure 1.
The temporal relationship between the CS and US in both delay and trace conditioning. Delay CSs lasted 850 ms and coterminated with a 100 ms US presentation (a). Trace CSs lasted 250 ms and were followed by a 500 ms trace interval before a 100 ms US presentation (b). During pseudoconditioning, participants received four blocks each of delay CS alone, trace CS alone and airpuff alone while in acquisition, participants received 16 delay and 16 trace blocks in an alternating fashion (e). Dotted lines represent the 250 ms time window used to analyze data during pseudoconditioning (top) and acquisition (bottom) (d).

