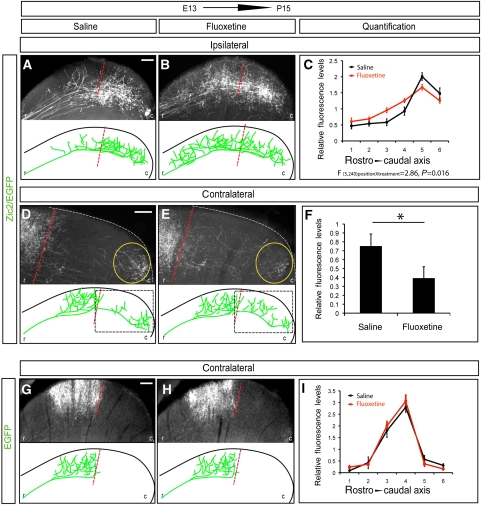
Figure 7.
Zic2-positive but not Zic2-negative axons respond to fluoxetine treatment. The pictures show representative sagittal sections of the SC from P15 mice that were electroporated at E13.5 in central retina and then treated with saline or fluoxetine from P0 to P15. To summarize the results, schematic representations of collicular sections are shown below each image. The red-dashed lines delineate the caudal limit of the correct TZ according to the central location of the targeted RGCs in the retina. (A, B) In the ipsilateral SC of animals electroporated with Zic2/EGFP, axons projected to more rostral areas in fluoxetine-treated than in saline-treated animals. (C) Quantitative analysis of fluorescence measurements in sagittal sections of colliculus electroporated with Zic2/EGFP treated with saline versus fluoxetine shows a significant displacement of the projection to more rostral positions after fluoxetine treatment (F (5.240) position × treatment=2.86, P=0.016). Data obtained from five animals and four equivalent sections from each animal for each condition. (D, E) High-magnification pictures of the caudal portion of the contralateral SC (squared area) of mice electroporated with Zic2/EGFP show that axons treated with fluoxetine project to more rostral areas than those treated with saline. (F) Quantification of the levels of fluorescence in the caudal region of collicular sagittal sections (yellow circle) shows a significant decrease in the amount of fluorescence in the fluoxetine-treated animals compared with the saline-treated animals (*P⩽0.001, Student's unpaired t-test). Data were obtained from six animals and three sections from each animal for each condition. (G, H) In the contralateral SC of animals electroporated with EGFP, axons project in the medial region in both saline and fluoxetine-treated mice. As EGFP axons did not project into the ipsilateral side, the ipsilateral colliculi are not shown. (I) No significant differences were found after quantitative analysis of fluorescence measurements in sections of SCs from EGFP-electroporated mice treated with saline versus fluoxetine. Data were obtained from three animals and three equivalent sections from each animal per treatment. Error bars indicate±s.e.m. Statistical analysis was performed using a two-way ANOVA. r, rostral; c, caudal. Scale bars: 100 μm.

