Figure 3.
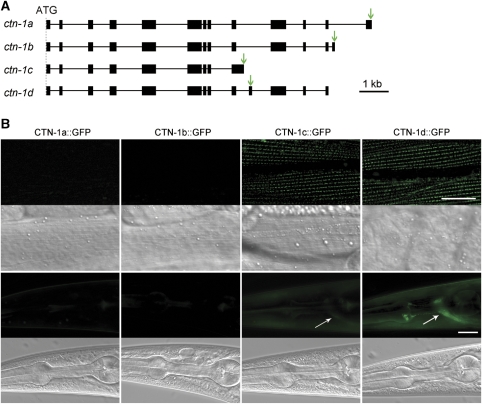
Expression patterns of ctn-1 splicing variants. (A) Intron–exon organization of ctn-1 splicing variants. GFP was inserted into the unique exon of each splicing variant. The arrows indicate the locations of GFP insertion. (B) No expression was observed for CTN-1a and CTN-1b. Both CTN-1c and CTN-1d were strongly expressed in body-wall muscle cells. CTN-1d was also strongly expressed in neurons, as indicated by the bright fluorescence signal in the nerve ring (arrow), whereas CTN-1c appeared to be weakly expressed only in some neurons (arrow). A corresponding DIC image was shown below each fluorescent image. Scale bar=20 μm. A full-colour version of this figure is available at The EMBO Journal Online.

