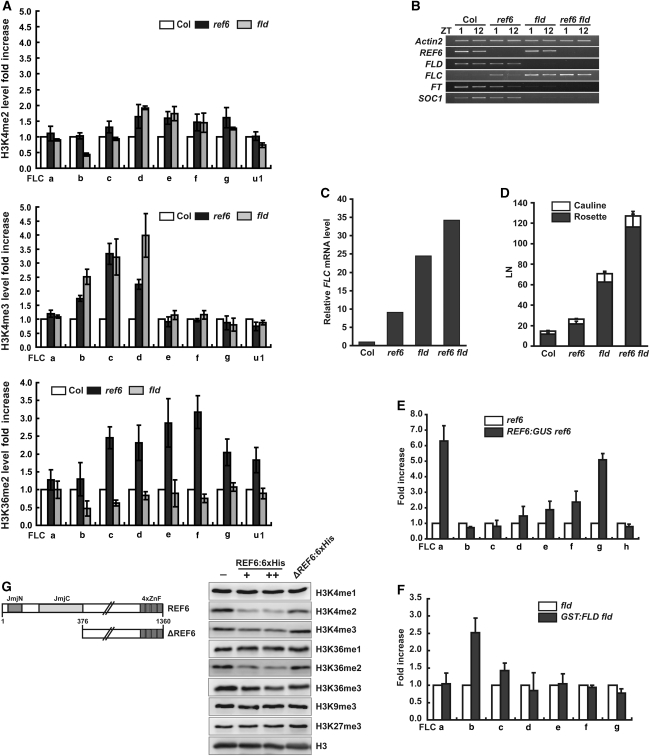
Figure 2.
Repression of FLC chromatin by REF6 and FLD. (A) ChIP–qPCR analyses of FLC chromatin for regions described in Figure 1A. Error bars represent s.e. (B, C) Expression of flowering genes at zeitgeber (ZT) 1 and 12 in ref6, fld, and ref6 fld as studied by reverse transcription (RT)–PCR (B) or RT–qPCR at ZT2 (C). FT: FLOWERING LOCUS T. SOC1: SUPPRESSOR OF OVEREXPRESSION OF CONSTANS 1. The values are the means of three technical replicates (C). (D) Flowering time of ref6, fld, and ref6 fld in LD as scored by the leaf number (LN). Error bars represent s.d. (E, F) ChIP–qPCR was used to test the direct association of REF6:GUS (E) or GST:FLD (F) with FLC chromatin using GUS (E) or GST (F) ab. Error bars represent s.e. (G) Domains in REF6 and ΔREF6 (left), and HDM activity of REF6:6xHis (right).

