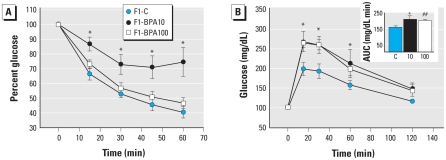
Figure 4.
Blood glucose homeostasis in F1-C, F1-BPA10, and F1-BPA100 mice at 6 months of age shown by (A) IPITT and (B) IPGTT performed in the same group of animals. The inset in B represents the mean total glucose AUC. Data are expressed as mean ± SE (n = 8).
*p < 0.05 for F1-BPA10 and F1-BPA100 mice compared with F1-C. ##p = 0.05.

