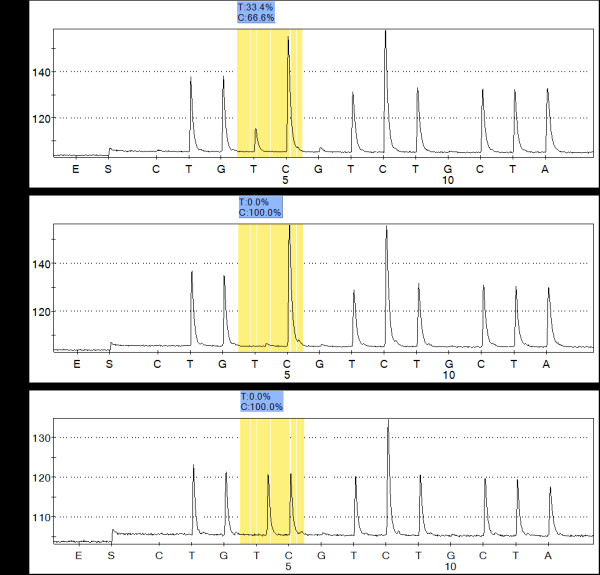
Figure 4.

Quantification of mtDNA 1555A > G mutation load by pyrosequencing. A Sample II2 heteroplasmic for A1555G. B Sample homoplasmic for A1555G. C Sample for wild-type genotype. Select 3 Pyrograms for representative samples. The boxes show the AQ values obtained for the allele. The value for the mutated allele represents the level of heteroplasmy in the samples.
