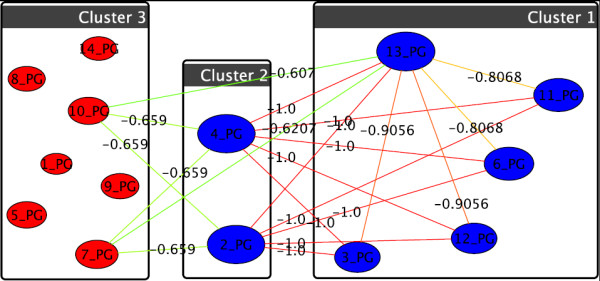
Figure 11.

Graph-clustering correlation network for phosphatidylglycerol showing the difference between U87+DI312/24hr+SN38/24hr and U87+p53/24hr+SN38/24hr. Correlation network with threshold 0.6 for phosphatidylglycerols for T1 and T2. Very clearly v2 = (32:0)+0 and v4 = (32:1)+0 stand out. in T2 (colors) they abruptly behave as Cluster 1, v13 = (40:6) parallels this, but much weaker. They went from close to 0 for T1 to 100 in T2. Since the left hand nodes retain their cluster they hardly differ in T1 and T2.
